Last Update: February 2016, Data sample: 1963Q1 to 2015Q4

Source: Bureau of Labor Statistics
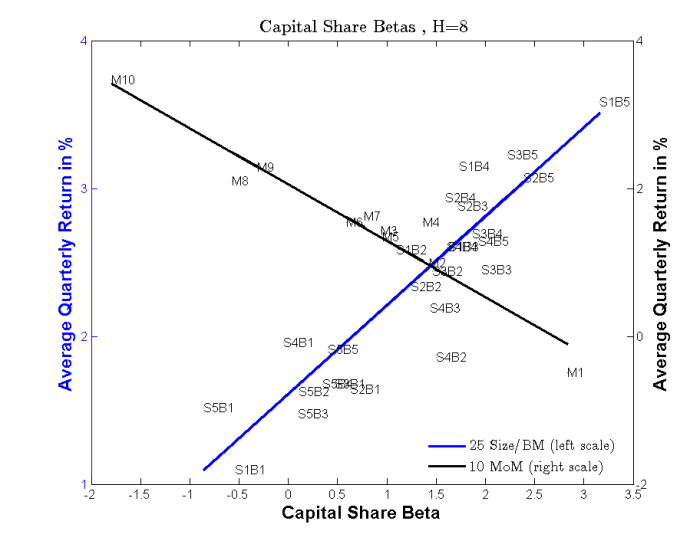
In Capital Share Risk and Shareholder Heterogeneity in U.S. Stock Pricing, Martin Lettau, Sydney Ludvigson and I found that a single risk factor — low frequency fluctuations in the U.S. national capital share (KS) — can explain up to 85% and 95% variations in average returns on portfolios sorted by size-book/market values and momentum respectively. In addition, betas for FF factors cannot survive in a horse race where a long horizon capital share beta is included. Our results are based on the quarterly data sample that span the periods from 1963Q1 to 2013Q4.
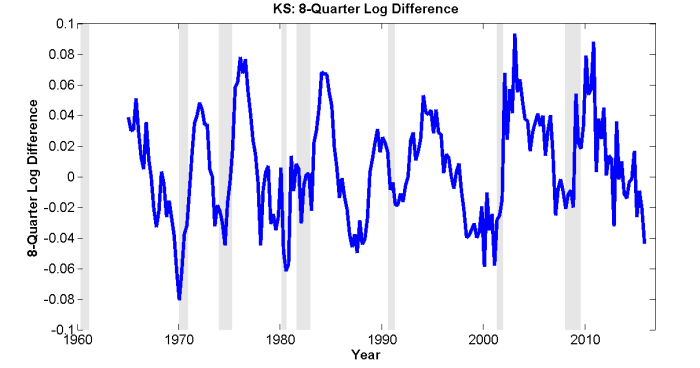
In this blog, I annually update the time series of KS and horse racing results. The capital share is defined as KS = 1- LS, where LS is the national non-farm sector labor share obtained from BLS. The returns data of test asset portfolios are obtained from Professor Kenneth French’s website.
Details on the Fama-Macbeth regressions, and horse racing are available in the paper.
(Click to enlarge)